BamSnap


BamSnap is a visualization tool for aligned BAM files that allows to generate high-quality snapshots of read level data in high-throughput, processing up to thousands of files. BamSnap is a command-line software based on python.

Setting up BamSnap
In a command prompt or terminal window, run the following commands to install and test the software.
$ pip install bamsnap
$ bamsnap -bam test.bam -pos chr1:7364529 -out test.bam.png
More examples and commands are available in gallery. Use -h to list the options available for bamsnap.
$ bamsnap -h
Source code is available on github.
Contents
Installation
Prerequisites
Install from source
$ git clone https://github.com/parklab/bamsnap
$ cd bamsnap
$ python setup.py install
$ bamsnap
Install from docker hub
$ docker pull danielmsk/bamsnap
$ docker images
REPOSITORY TAG IMAGE ID CREATED SIZE
danielmsk/bamsnap latest f9f6e61c7673 2 hours ago 997MB
$ docker run --rm -it -v /local_directory_path:/directory_path_in_image \
danielmsk/bamsnap bamsnap \
-bam /directory_path_in_image/test.bam \
-pos 1:7364529 \
-out /directory_path_in_image/test.png
The docker image can be pulled from the docker hub site (https://hub.docker.com/r/danielmsk/bamsnap). When you are using bamsnap from docker image, you should assign the local directory path (volume) and the image direcotry path (volume) using -v option.
Gallery
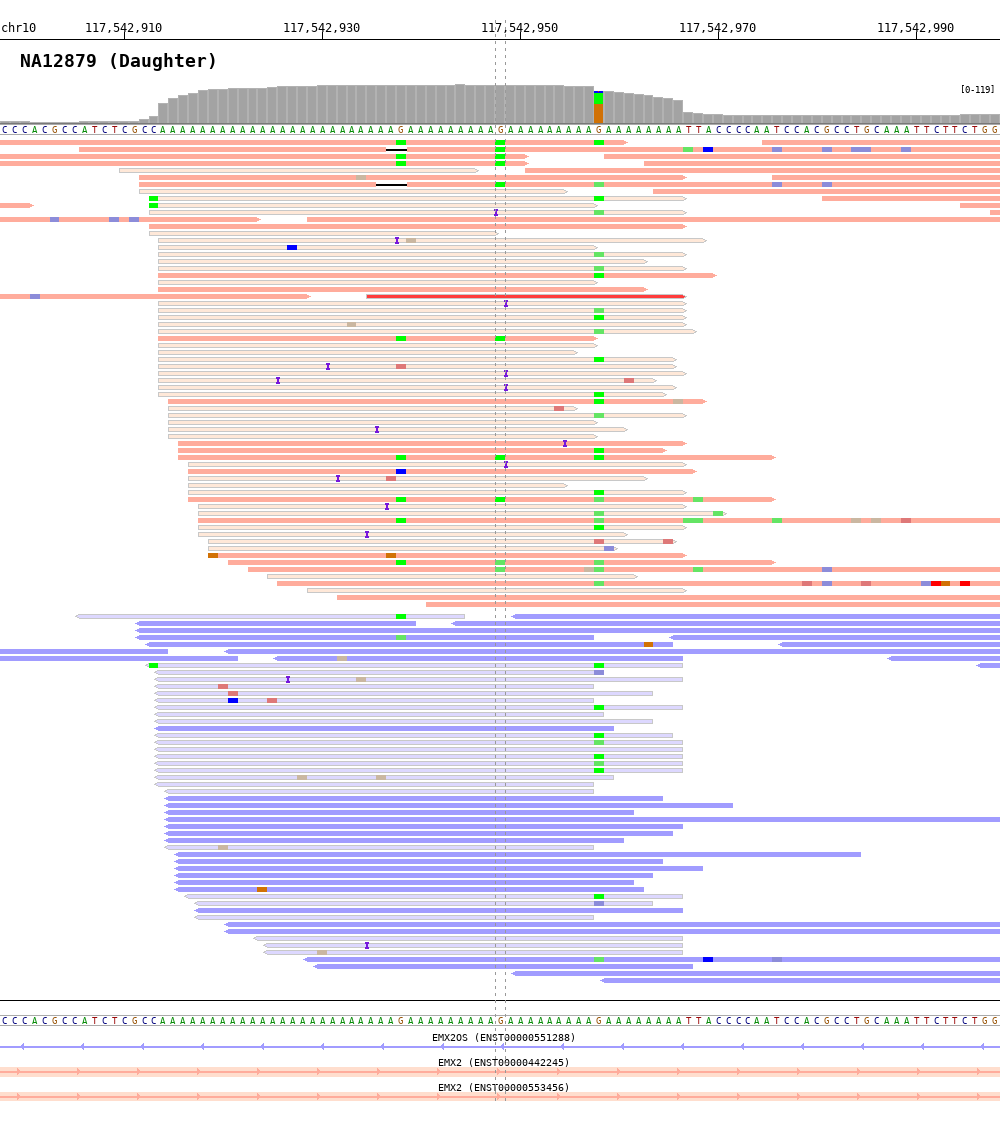
$ bamsnap \
-bam ./data/NA12879.bam \
-title "NA12879 (Daughter)" \
-pos chr10:117542948 \
-out ./out/NATRIO_chr10_117542948.png \
-read_group strand
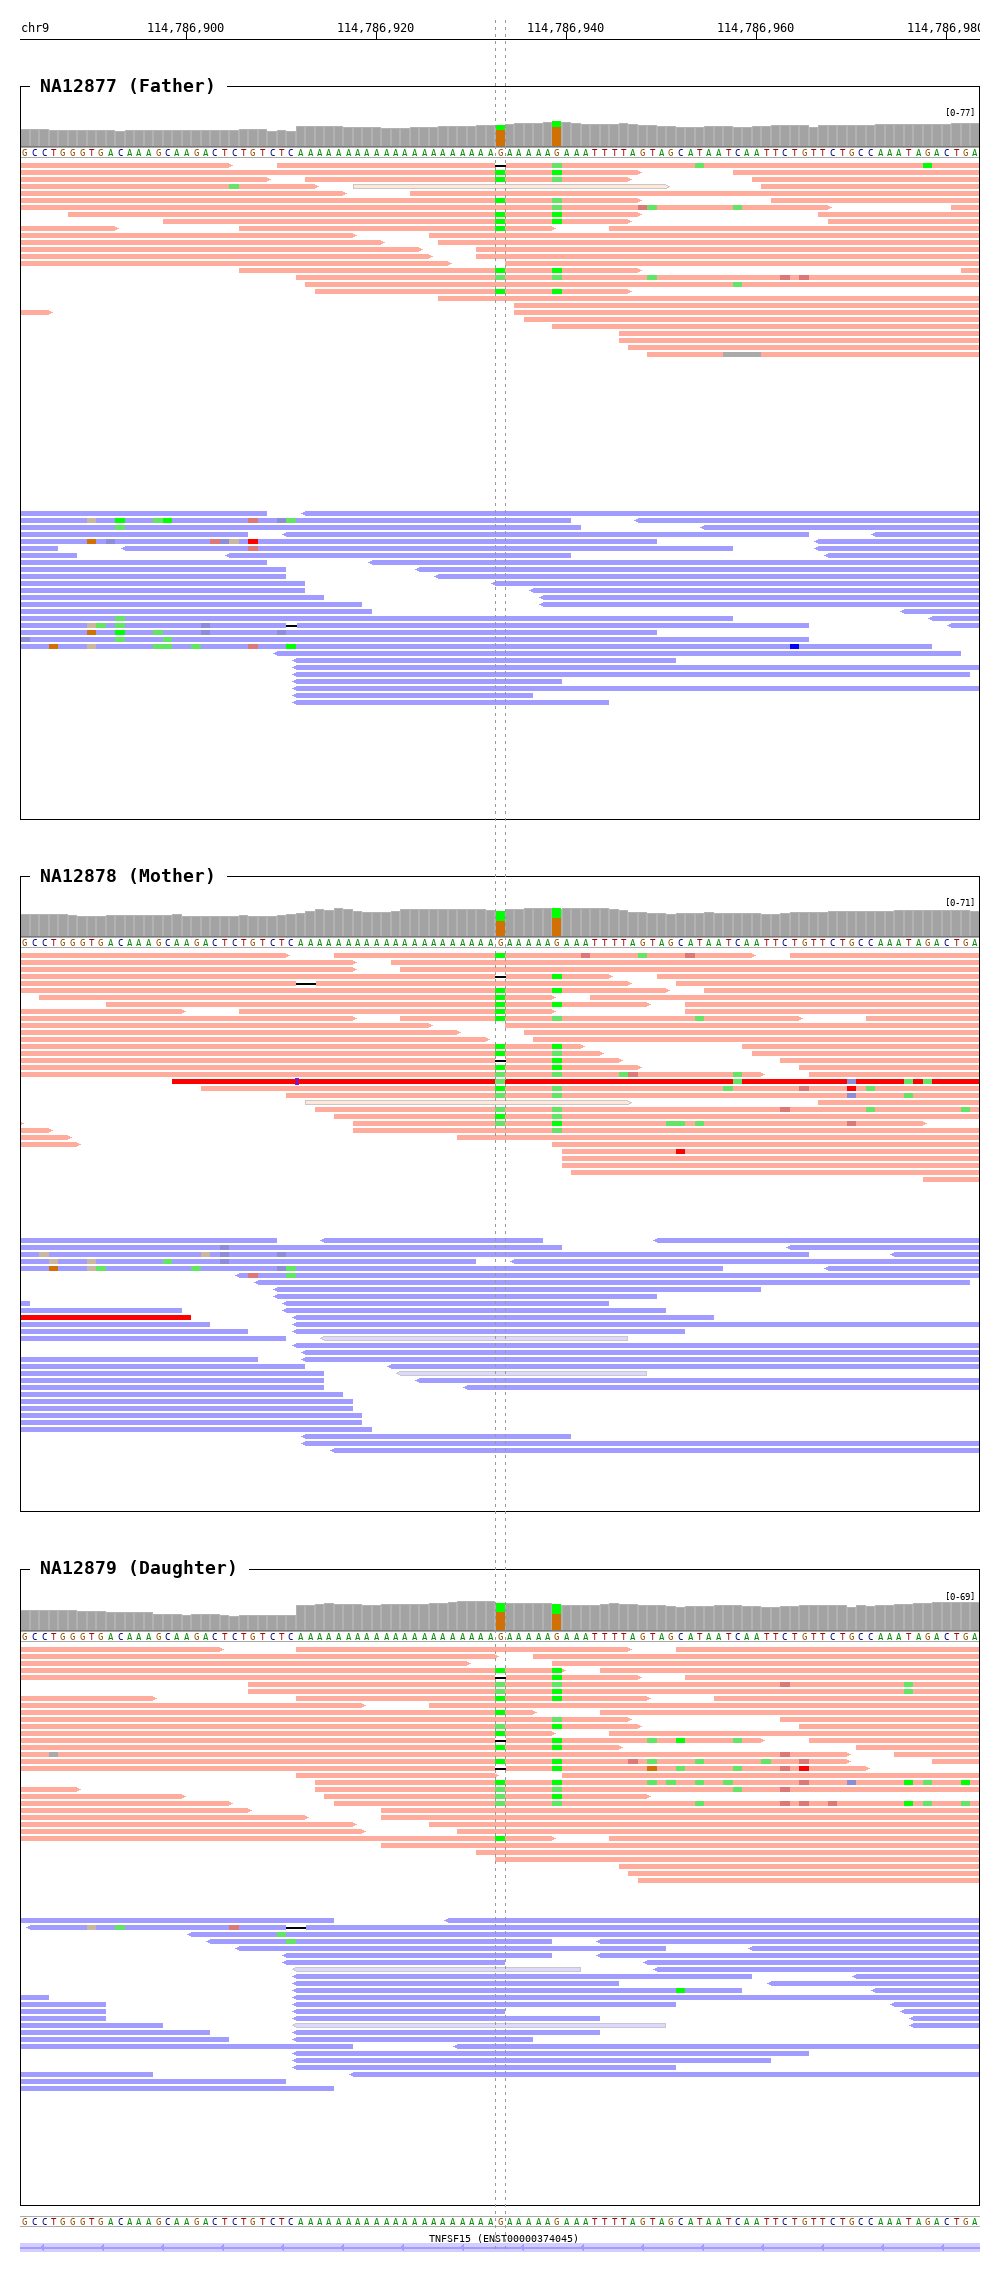
$ bamsnap \
-bam ./data/NA12877.bam \
./data/NA12878.bam \
./data/NA12879.bam \
-title "NA12877 (Father)" "NA12878 (Mother)" "NA12879 (Daughter)" \
-pos chr9:114786933 \
-out ./out/NATRIO_chr9:114786933.png \
-draw coordinates bamplot base gene \
-bamplot coverage base read \
-margin 50 \
-read_group strand \
-plot_margin_left 20 \
-plot_margin_right 20 \
-border

$ bamsnap \
-bam ./data/NA12879.bam \
-pos chr10:117542948 \
-no_title \
-draw bamplot \
-bamplot coverage \
-out ./out/NATRIO_chr10_117542948_3.png \
-separator_height 0

$ bamsnap \
-bam ./data/NA12879.bam \
-pos chr10:117542948 \
-no_title \
-draw coordinates \
-out ./out/NATRIO_chr10_117542948_coordinates1.png \
-no_target_line \
-coordinates_axisloc bottom
Color by inter-chromosomal rearrangements

$ bamsnap \
-bam ./data/test_SV1_chr1_37775710.bam \
-title "SVA example (chr1:37775710)" \
-pos chr1:37775710 \
-out ./out/test_SV1-3.png \
-bamplot coverage read \
-margin 1000 \
-no_target_line \
-read_color_by interchrom \
-save_image_only
Deletion

1 2 3 4 5 6 7 8 9 10 | $ bamsnap \
-bam ./data/test_DEL_4_180097876_180097877.bam \
-pos 4:180097878-180098507 \
-margin 1000 \
-title deletion \
-out ./out/test_DEL_1.png \
-refversion hg19 \
-show_soft_clipped \
-read_color_by interchrom \
-save_image_only
|

1 2 3 4 5 6 7 8 9 10 | $ bamsnap \
-bam ./data/test_DEL_chr12_47977510_F.bam ./data/test_DEL_chr12_47977510_M.bam ./data/test_DEL_chr12_47977510_P.bam \
-vcf ./data/test_DEL_chr12_47977510.vcf \
-margin 1000 \
-title "Father" "Mother" "Child" \
-out ./out/test_DEL_chr12_2.png \
-show_soft_clipped \
-read_color_by interchrom \
-read_group strand \
-save_image_only
|
Optional arguments
| -h, --help | show this help message and exit |
| -v, --version | show program’s version number and exit |
| -silence | don’t print any log. |
| -debug | turn on debugging mode |
| -process | number of process for multi-processing (default=1) |
Input files
| -bam | bam file(s) to use |
| -bamlist | file listing bam files to use |
| -title | label(s) to be used as title for bam file(s) |
| -no_title | (default: false) do not draw title |
| -title_fontsize | |
| (default=18) font size of title | |
| -pos | genomic position(s) to plot |
| -vcf | file listing genomic positions to plot in VCF format |
| -bed | file listing genomic positions to plot in BED format |
| -ref | reference sequence as fasta file |
| -ref_index_rebuild | |
| (default=false) rebuild fasta index file (.fai) | |
| -refversion | [hg38, hg19] (default=hg38) reference version |
| -conf | `configuration file`_ |
Output file
| -out | output file name or title of output file |
| -imagetype | [png, jpg] (default=png) output file type |
| -save_image_only | |
| (default=false) save image only | |
| -image_dir_name | |
| image directory name | |
| -zipout | (default=false) make a single zip file |
| -separated_bam | (default=false) draw a plot for each bam |
Plot layout
| -draw | (default=coordinates bamplot base gene) track composition |
| -bamplot | (default=coverage base read) track composition in bamplot |
| -width | (default=1000) image width (unit:px) |
| -height | image height (unit:px) |
| -bgcolor | (default=FFFFFF) background color |
| -plot_margin_top | |
| (default=20) top margin size of plot | |
| -plot_margin_bottom | |
| (default=20) bottom margin size of plot | |
| -plot_margin_left | |
| (default=0) left margin size of plot | |
| -plot_margin_right | |
| (default=0) right margin size of plot | |
| -border | (default=false) draw border in plot |
| -separator_height | |
| (default=30) separator’s height | |
Read alignment track
| -read_thickness | |
| (default=5) read thickness (unit:px) | |
| -read_gap_height | |
| (default=2) read gap height (unit:px) | |
| -read_gap_width | |
| (default=2) read gap width (unit:px) | |
| -read_bgcolor | (default=FFFFFF) read background color |
| -read_color | (default=C8C8C8) read color |
| -margin | (default=50) genomic margin size |
| -center_line | (default=false) draw center line |
| -no_target_line | |
| (default=false) do not draw target line | |
| -read_group | [‘’, strand] (default=’’) read color |
| -read_pos_color | |
| (default=FFAC9C) positive strand read color | |
| -read_neg_color | |
| (default=A19CFF) negative strand read color | |
| -read_color_by | [‘’, strand, intercom] (default=’’) read color by |
| -read_color_interchrom_chr1 | |
| (default=64689b) paired read color located in chromosome 1 | |
| -read_color_interchrom_chr2 | |
| (default=D6503A) paired read color located in chromosome 2 | |
| -read_color_interchrom_chr3 | |
| (default=87AA62) paired read color located in chromosome 3 | |
| -read_color_interchrom_chr4 | |
| (default=F2EB89) paired read color located in chromosome 4 | |
| -read_color_interchrom_chr5 | |
| (default=597E98) paired read color located in chromosome 5 | |
| -read_color_interchrom_chr6 | |
| (default=C5763E) paired read color located in chromosome 6 | |
| -read_color_interchrom_chr7 | |
| (default=70BFE7) paired read color located in chromosome 7 | |
| -read_color_interchrom_chr8 | |
| (default=91307F) paired read color located in chromosome 8 | |
| -read_color_interchrom_chr9 | |
| (default=80DE6E) paired read color located in chromosome 9 | |
| -read_color_interchrom_chr10 | |
| (default=DCA5B5) paired read color located in chromosome 10 | |
| -read_color_interchrom_chr11 | |
| (default=A35A24) paired read color located in chromosome 11 | |
| -read_color_interchrom_chr12 | |
| (default=978DA0) paired read color located in chromosome 12 | |
| -read_color_interchrom_chr13 | |
| (default=D16525) paired read color located in chromosome 13 | |
| -read_color_interchrom_chr14 | |
| (default=DCA167) paired read color located in chromosome 14 | |
| -read_color_interchrom_chr15 | |
| (default=8C79B9) paired read color located in chromosome 15 | |
| -read_color_interchrom_chr16 | |
| (default=E9BD71) paired read color located in chromosome 16 | |
| -read_color_interchrom_chr17 | |
| (default=4B2669) paired read color located in chromosome 17 | |
| -read_color_interchrom_chr18 | |
| (default=D7E4BF) paired read color located in chromosome 18 | |
| -read_color_interchrom_chr19 | |
| (default=733B91) paired read color located in chromosome 19 | |
| -read_color_interchrom_chr20 | |
| (default=BC2D7A) paired read color located in chromosome 20 | |
| -read_color_interchrom_chr21 | |
| (default=EBD176) paired read color located in chromosome 21 | |
| -read_color_interchrom_chr22 | |
| (default=6E786F) paired read color located in chromosome 22 | |
| -read_color_interchrom_chrX | |
| (default=D5AA00) paired read color located in chromosome X | |
| -read_color_interchrom_chrY | |
| (default=A9D400) paired read color located in chromosome Y | |
| -show_soft_clipped | |
| (default=False) show soft clipped part | |
Base track
| -base_fontsize | (default=9) font size of base |
| -base_height | (default=30) base track height |
| -base_margin_top | |
| (default=0) top margin size of base track | |
| -base_margin_bottom | |
| (default=0) bottom margin size of base track | |
Coverage track
| -coverage_height | |
| (default=40) coverage track height | |
| -coverage_fontsize | |
| (default=9) coverage font size | |
| -coverage_vaf | (default=0.2) coverage variant allele fraction threshold |
| -coverage_color | |
| (default=C8C8C8) coverage color | |
| -coverage_bgcolor | |
| (default=FFFFFF) coverage track background color | |
Heatmap track
| -heatmap_height | |
| (default=5) coverage heatmap height | |
| -heatmap_bgcolor | |
| (default=FFFFFF) coverage heatmap track background color | |
Gene track
| -gene_height | (default=50) gene track height |
| -gene_fontsize | (default=10) font size of gene track |
| -gene_pos_color | |
| (default=FFAC9C) positive strand color | |
| -gene_neg_color | |
| (default=A19CFF) negative strand color | |
Coordinates track
| -coordinates_height | |
| (default=20) coordinates height | |
| -coordinates_fontsize | |
| (default=12) coordinates font size | |
| -coordinates_axisloc | |
| [top, bottom, middle] (default=bottom) coordinates axis location | |
| -coordinates_bgcolor | |
| (default=FFFFFF) coordinates background color | |
| -coordinates_labelcolor | |
| (default=000000) coordinates label color | |
Input files
Alignment file
BamSnap requires sorted and indexed bam or cram files. For each alignment file, the index file (.bam.bai, .bai, .cram.crai, or .crai) should be located in the same directory.
Input files (-bam for BAM or CRAM format)
Input files to be used can be specified using the -bam argument. It is possible to specify a single file or list multiple files. Also, a cram file can be assigned with -bam argument.
$ bamsnap -bam ./data/NA12878.bam
$ bamsnap -bam ./data/NA12878.bam ./data/NA12877.bam ./data/NA12879.bam
$ bamsnap -bam ./data/NA12878.cram
$ bamsnap -bam ./data/NA12878.cram ./data/NA12877.bam ./data/NA12879.bam
Note
BamSnap supports both the indexed BAM and the indexed CRAM format for the alignment files.
Title of alignment file(s) (-title)
A label can be assigned to each of the bam files using the -title argument. The label will be used as title for the corresponding plot.
$ bamsnap -bam ./data/NA12879.bam -title NA12879
$ bamsnap -bam ./data/NA12879.bam -title "NA12879 (Daughter)"
$ bamsnap -bam ./data/NA12878.bam ./data/NA12877.bam ./data/NA12879.bam \
-title "NA12877 (Father)" "NA12878 (Mother)" "NA12879 (Daughter)"

If no label is specified, the file name will be used as title by default.

To completely remove the title use the -no_title option.
$ bamsnap -bam ./data/NA12879.bam -no_title

Note
By default, the title font size is 18. It is possible to change the font size with -title_fontsize (e.g. -title_fontsize 10).
BAM list file (-bamlist)
$ bamsnap -bamlist ./data/NATRIO_bamlist.txt
It is possible to provide a single file listing all the input bam files to be used. The expected format is a tabular (tab-separated) file. The first column is mandatory and must contain the paths to files, the second column is optional and allows to associate labels to files. It also supports .bam and .cram file.
# example of bamlist file with lables
./data/NA12878.bam NA12878 (F)
./data/NA12877.cram NA12877 (M)
./data/NA12879.bam NA12879 (D)
# example of bamlist file
./data/NA12878.bam
./data/NA12877.cram
./data/NA12879.bam
Genomic position
Genomic position (-pos)
Genomic positions to plot can be specified with the -pos option. It is possible to specify a single position or to list multiple regions.
$ bamsnap -bam ./data/NA12878.bam -pos chr1:7364529
$ bamsnap -bam ./data/NA12878.bam -pos chr1:7364529 chr3:7364529 chr1:7364529
$ bamsnap -bam ./data/NA12878.bam -pos chr1:7364509-7364559
Note
Chromosome names must match between the positions that are specified and the bam files. For example, ‘chr’ prefix should be omitted from regions if the bam files don’t use ‘chr’ prefix in chromosome names (ex. 1:7364529).
VCF file (-vcf)
The program can read .vcf (raw) and .vcf.gz (gzip or bgzip compressed vcf) files.
$ bamsnap \
-bam ./data/NA12878.bam \
-vcf ./data/multiple_variants.vcf.gz \
-out ./out/mutiple_variants_NA12878
BED file (-bed)
$ bamsnap \
-bam ./data/NA12878.bam \
-bed ./data/multiple_regions.bed \
-out ./out/mutiple_regions_NA12878
Reference sequence file
User can provide a fasta file to be used as reference using the -ref option. Alternatively, it is possible to specify a reference version to be used with -refversion. The program will automatically obtain the corresponding sequence from UCSC database. The current default version for -refversion is hg38. -refversion hg19 force the use of hg19 release.
FASTA file (-ref)
$ bamsnap \
-bam ./data/NA12879.bam_chr10_117542947.bam \
-ref ./fasta/GRCh38_full_analysis_set_plus_decoy_hla.fa
Note
If a fasta file is specified, the program checks for its index file (.fai). If the index file does not exist it will be automatically created.
If the index file exists but is older than the fasta file, the program can rebuild the index using the -ref_index_rebuild option.
Output files
-out option allows to specify the output directory or the name for the image file (if a single image file is the output).
Image file (PNG, JPG)
By default, the program generates image files in png format. It is possible to select jpg format using the -imagetype option.
$ bamsnap \
-bam ./data/NA12878.bam \
-pos chr10:117542948 \
-out ./out/NA12878_chr10_117542948.jpg \
-imagetype jpg \
-save_image_only
Note
To save only snap image files, use the -save_image_only option.
Inside the output directory, images are saved in a default sub-directory. It is possible to rename this folder using the the -image_dir_name option.
$ bamsnap \
-bam ./data/NA12879.bam \
-vcf ./data/NATRIO_test_3.vcf \
-out ./out/NATRIO_test_3 \
-image_dir_name test_images
This example creates ./out/NATRIO_test_3/test_images folder that contains the generated snap image files.
By default, the program generates a single plot file for multiple bam files. -separated_bam option allows to generate a plot file for each of the bam files.
Compressed file (-zipout)
It is possible to save a compressed (zip) output file using the -zipout option.
$ bamsnap \
-bam ./data/NA12879.bam \
-vcf ./data/NATRIO_test_3.vcf \
-out ./out/NATRIO_test_3 \
-save_image_only \
-zipout
This example creates ./out/NATRIO_test_3.zip file.
HTML file (index html)
If -save_image_only is not used, index.html is generated by default.
Plot options

Plot composition (-draw, -bamplot)
It is possible to add track list to a plot using the -draw option. The default tracks list is coordinates bamplot base gene. bamplot contains coverage base read tracks.
-draw: track list (default: -draw coordinates bamplot base gene)-bamplot: plot (default: -bamplot coverage base read)-bamplot read: see more track options-bamplot coverage: see more track options-bamplot base: see more track options
Plot layout options
-width: image file size : width (unit:px, default:1000)-height: image file size : height (unit:px)-bgcolor: background color (default:FFFFFF)-plot_margin_top: top margin size of plot-plot_margin_bottom: bottom margin size of plot-plot_margin_left: left margin size of plot-plot_margin_right: right margin size of plot-separator_height: separator’s height-border: draw border in plot
Read alignment track (-bamplot read)
Layout options

-read_thickness(default=5) : read thickness (unit:px)-read_gap_height(default=2) : read gap height (unit:px)-read_gap_width(default=2) : min size of read gap width (unit:px)-read_bgcolor(default=’FFFFFF’) : read background color-read_color(default=’C8C8C8’) : read color-center_line(default=false): draw center line-no_target_line(default=false): do not draw target line
Read group (-read_group)
It is possible to plot the reads grouped by strand using the -read_group strand option.
1 2 3 4 5 6 7 8 | $ bamsnap \
-bam ./data/NA12879.bam \
-pos chr10:117542948 \
-no_title \
-draw bamplot \
-bamplot read \
-out ./out/NATRIO_chr10_117542948_6.png \
-read_group strand
|

Read color (-read_color_by)
The program provides color sets for strand and chromosomes.
Color by strand (-read_color_by strand)

1 2 3 4 5 6 7 8 9 10 | $ bamsnap \
-bam ./data/test_SV1_chr1_37775710.bam \
-title "SVA example (chr1:37775710)" \
-pos chr1:37775710 \
-out ./out/test_SV1-4.png \
-bamplot coverage read \
-margin 1000 \
-no_target_line \
-read_color_by strand \
-save_image_only
|
The reads color by strand can be defined using -read_pos_color and -read_neg_color options.
-read_pos_color(default=’FFAC9C’) : positive strand read color-read_neg_color(default=’A19CFF’) : negative strand read color
Color by inter-chromosomal rearrangements (-read_color_by interchrom)
1 2 3 4 5 6 7 8 9 10 | $ bamsnap \
-bam ./data/test_SV1_chr1_37775710.bam \
-title "SVA example (chr1:37775710)" \
-pos chr1:37775710 \
-out ./out/test_SV1-3.png \
-bamplot coverage read \
-margin 1000 \
-no_target_line \
-read_color_by interchrom \
-save_image_only
|
The reads color by chromosome can be defined using -read_color_interchrom_chr1, -read_color_interchrom_chr2, .., and -read_color_interchrom_chrY options.
- Default color codes
- chr1: #64689b ⬅⬅⬅⬅
- chr2: #D6503A ⬅⬅⬅⬅
- chr3: #87AA62 ⬅⬅⬅⬅
- chr4: #F2EB89 ⬅⬅⬅⬅
- chr5: #597E98 ⬅⬅⬅⬅
- chr6: #C5763E ⬅⬅⬅⬅
- chr7: #70BFE7 ⬅⬅⬅⬅
- chr8: #91307F ⬅⬅⬅⬅
- chr9: #80DE6E ⬅⬅⬅⬅
- chr10: #DCA5B5 ⬅⬅⬅⬅
- chr11: #A35A24 ⬅⬅⬅⬅
- chr12: #978DA0 ⬅⬅⬅⬅
- chr13: #D16525 ⬅⬅⬅⬅
- chr14: #DCA167 ⬅⬅⬅⬅
- chr15: #8C79B9 ⬅⬅⬅⬅
- chr16: #E9BD71 ⬅⬅⬅⬅
- chr17: #4B2669 ⬅⬅⬅⬅
- chr18: #D7E4BF ⬅⬅⬅⬅
- chr19: #733B91 ⬅⬅⬅⬅
- chr20: #BC2D7A ⬅⬅⬅⬅
- chr21: #EBD176 ⬅⬅⬅⬅
- chr22: #6E786F ⬅⬅⬅⬅
- chrX: #D5AA00 ⬅⬅⬅⬅
- chrY: #A9D400 ⬅⬅⬅⬅
- other chromosome: #555555 ⬅⬅⬅⬅
Show soft clipped part (-show_soft_clipped)

1 2 3 4 5 6 7 8 9 10 11 | $ bamsnap \
-bam ./data/test_SV1_chr1_37775710.bam \
-title "SVA example (chr1:37775710)" \
-pos chr1:37775710 \
-out ./out/test_SV1-3_1.png \
-bamplot coverage read \
-margin 1000 \
-no_target_line \
-show_soft_clipped \
-read_color_by interchrom \
-save_image_only
|
Deletion
1 2 3 4 5 6 7 8 9 10 | $ bamsnap \
-bam ./data/test_DEL_4_180097876_180097877.bam \
-pos 4:180097878-180098507 \
-margin 1000 \
-title deletion \
-out ./out/test_DEL_1.png \
-refversion hg19 \
-show_soft_clipped \
-read_color_by interchrom \
-save_image_only
|
The insert size threshold between read mates to detect deletions is set by -insert_size_del_threshold (default is 1000).
The color of reads for deletion is #FF0000 by default. You can change the color using -read_color_deletion option.
Coverage track (-bamplot coverage)

-coverage_height(default=40) : coverage plot height-coverage_fontsize(default=9) : coverage font size-coverage_vaf(default=0.2) : coverage variant allele fraction threshold-coverage_color(default=C8C8C8) : coverage color-coverage_bgcolor(default=FFFFFFF) : coverage plot background color
Base track (-draw base, -bamplot base)
Layout options

-base_fontsize(default=9) : font size of base-base_height(default=30) : base track height-base_margin_top(default=0) : top margin size of base track-base_margin_bottom(default=0) : bottom margin size of base track
Base track types
The base track has three formats which are automatically defined based on the width-span of the base.

$ bamsnap \
-bam ./data/NA12879.bam \
-draw bamplot \
-bamplot coverage base \
-pos chr10:117542948 \
-separator_height 0 \
-margin 500 \
-no_title \
-width 700 \
-plot_margin_top 0 \
-plot_margin_bottom 0 \
-out ./out/NATRIO_chr10_117542948_baseplot_ex1.png

$ bamsnap \
-bam ./data/NA12879.bam \
-draw bamplot \
-bamplot coverage base \
-pos chr10:117542948 \
-separator_height 0 \
-margin 50 \
-no_title \
-width 700 \
-plot_margin_top 0 \
-plot_margin_bottom 0 \
-out ./out/NATRIO_chr10_117542948_baseplot_ex2.png

$ bamsnap \
-bam ./data/NA12879.bam \
-draw bamplot \
-bamplot coverage base \
-pos chr10:117542948 \
-separator_height 0 \
-margin 10 \
-no_title \
-width 700 \
-plot_margin_top 0 \
-plot_margin_bottom 0 \
-out ./out/NATRIO_chr10_117542948_baseplot_ex3.png
Gene track (-draw gene)

-gene_height(default=50) : gene track height-gene_fontsize(default=10) : font size of gene track-gene_pos_color(default=FFAC9C) : positive strand color-gene_neg_color(default=A19CFF) : negative strand color
Coordinates track (-draw coordinates)
-coordinates_height(default=20) : coordinates height-coordinates_fontsize(default=12) : coordinates font size-coordinates_axisloc [top, bottom, middle](default=bottom) : coordinates axis location-coordinates_bgcolor(default=FFFFFF) : coordinates background color-coordinates_labelcolor(default=000000) : coordinates label color
Axis location (-coordinates_axisloc)
- bottom location:
-coordinates_axisloc bottom
- top location:
-coordinates_axisloc top

- middle location:
-coordinates_axisloc middle

Heatmap track (-bamplot heatmap)
-heatmap_height(default=5) : coverage heatmap height-heatmap_bgcolor(default=FFFFFF) : coverage heatmap background color
Version History
v0.2.x release series
- 0.2.13 (2020.09.13):
- adjust target line for deletion in VCF
- 0.2.12 (2020.09.15):
- adjust target line for deletion in VCF
- 0.2.11 (2020.09.08):
- adjust target line
- 0.2.10 (2020.09.08):
- debug ValueError when MD tag of read is missing (`issue #5<https://github.com/parklab/bamsnap/issues/5>`_)
- 0.2.9 (2020.09.03):
- add
insert_size_del_thresholdfor deletion,insert_size_ins_thresholdfor insertsion - add
read_color_deletionfor deletion,read_color_insersionfor insertion
- add
- 0.2.8 (2020.08.25):
- add
show_soft_clippedoption to show soft clipped part of reads. (=> manual and `issue #4<https://github.com/parklab/bamsnap/issues/4>`_)
- add
- 0.2.7 (2020.08.24):
- add
-read_color_byoption for strand and inter-chromosomal rearrangement (=> manual ) - convert pileup-based to fetch-based for read retrieval in drawreadset.py
- add
- 0.2.6 (2020.07.22):
- debug in saving JPG file.
- debug in coodinates axis location (middle)
- debug in base font size.
- update document.
- 0.2.5 (2020.07.17):
- add multiprocessing option(
-process)
- add multiprocessing option(
- 0.2.4 (2020.07.15):
- fix bug in version number
- add separator height option
- add -ref_index_rebuild option (to prevent to rebuild a fasta index file, when the fasta index file is older than the fasta file.)
- update documentation
- 0.2.2 (2020.07.09):
- debug typos
- 0.2.0 (2020.06.09):
- add gene plot
- add base plot
- improve layout
- add coordinates
- add read group
v0.1.x release series
- 0.1 :
- basic read alignment view
Todo
- add SVG output
- add PDF output
- add bamviewer